State Rankings
Hawaii, Massachusetts, Minnesota, Connecticut, and Washington are the top-ranked states according to the 2019 Scorecard, which assesses all 50 states and the District of Columbia on more than 45 measures of access to health care, quality of care, service use and costs of care, health outcomes, and income-based health care disparities.
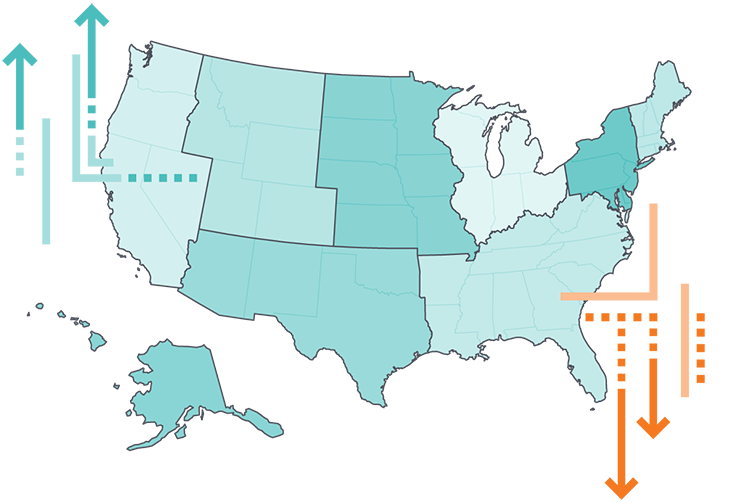
Which states moved up the most in the rankings between 2013 and 2017, and which states dropped?
California had the largest jump in rankings, up 12 spots. New York and Washington each moved up 10 spots in the rankings, and Rhode Island rose nine spots.
Delaware fell 17 spots in the rankings, while Wyoming, Virginia, and Maryland fell 11, nine, and seven spots, respectively.
Overall health system performance varies greatly among states
- Adjust the options to see how states performed when compared to the baseline, against other states in their region, and in different dimensions.
- Highlight a state by selecting its circle
States are arranged in rank order from left (best) to right (worst), based on their 2019 Scorecard rank.
States are arranged in rank order from top (best) to bottom (worst), based on their 2019 Scorecard rank.
What are the leading states by region?
- Great Lakes
Wisconsin - Mid-Atlantic
New York - New England
Massachusetts - Plains
Minnesota - Rocky Mountain
Colorado - Southeast
Virginia - Southwest
Arizona - West
Hawaii
State health system performance varies within regions
- Select a state to highlight a region of the country.
- Choose a selected state to return to the national view.
Note: Regions are U.S. Census regions. Regional shading is based on performance among states within the region only. See Scorecard Methods for additional detail.
Which states improved on the most indicators?
Rhode Island improved on 21 of 45 indicators we track over time, the most of any state. Missouri, Washington, and West Virginia each improved on 19 indicators.
Delaware, Hawaii, New Mexico, and Wyoming each got worse on more indicators than they improved on.
More improvement than decline

Notes: Based on five-year trends for 45 of 47 total indicators (Disparity dimension not included); trend data are not available for all indicators. Bar length equals the total number of indicators with any improvement or worsening with an absolute value greater than 0.5 standard deviations (StDev) of the state distribution.
Share
What’s the trend?
On balance, the 2019 State Scorecard finds more improvement than decline between 2013 and 2017, but trends are mixed. Almost all states improved on more indicators than they worsened, but no state improved on a majority of indicators. Most states (42) saw little or no change on more indicators than they improved on.